
Scaling operations for an asset ERP
Overview
The product
NexFlow is a B2B SaaS that centralizes asset control and financial management. As the client base grew, onboarding — done entirely by CS on behalf of each client — became the bottleneck between closing the contract and the client extracting real value.
My role
Product Designer responsible for the end-to-end design. I ran the evaluative research, shadowed newly signed clients, facilitated cross-functional workshops with CS and product, architected the solution and coordinated the usability tests.
Team and duration
Me, a Product Owner, frontend and backend developers, and the CTO involved in the direction decisions. CS and Support acted as stakeholders and research sources. Roughly 1 month from discovery to deploy.
Discovery
The context
The internal data showed the what, but not the why. To form a solution hypothesis, I had to understand what was happening on the user's side and on CS's side during onboarding.
What we investigated
What we found
A wait with no yardstick
Shadowing revealed the biggest frustration: the time between signing and being able to use the product. Clients arrived expecting speed and found a wait they had no way to size up — with no visibility of when they would start operating.
Everything at once = paralysis
In the user interviews, it became clear what happened when access finally arrived: it came complete, all at once. The user faced an ocean of information with no idea where to start — paralysis, not engagement.
CS and Support as the map
The workshops with CS and Support revealed which modules concentrated the most questions, the most difficulty and the most perceived value for users — a direct steer for prioritizing what onboarding needed to cover first.
Underestimated capability
User research revealed that many already used other platforms and tools to manage their assets, and had more technical capability than the internal team assumed. The gap wasn't skill, it was structure.
No dominant model
The benchmark pointed to no standard approach — from high-touch to self-service, each model solved a piece of the problem. No ERP of the same size operated 100% self-service.
"I wish I'd had this when I signed up"
The core decision
The direction
Three paths were evaluated before settling on a direction.
Full self-service (discarded)
The ERP's complexity made the risk of abandonment too high with no support at all. The benchmark confirmed it: no ERP of the same size operated 100% self-service.
CS with partial automation (discarded)
Automating CS tasks without changing the process might have been safer, but the outcome would be smaller: TTV would stay high and the dependency on the internal team would remain intact.
Hybrid model (chosen)
Give users autonomy with CS repositioned as strategic support, not as the executor. The user leads; CS follows along and steps in only when the step demands it.
Progression, not a form
The paralysis came from receiving everything at once. The shift was treating activation as progressive construction — each step delivers value before asking for the next.
The hub as an anchor
The wait with no yardstick showed what was missing was a point of reference. The hub solves that: the user sees what they've done, what's left and what's optional — they can leave and come back without losing context.
CS repositioned, not removed
Instead of running the entire onboarding, CS moved to following the user's progress — present when a step demands it, available on request for the rest.
The tradeoffs
| Decision | Gain | Cost |
|---|---|---|
| Autonomy vs. residual dependency on CS | The user gains control of the initial activation | Human mediation wasn't fully eliminated — a conscious choice within the business model |
| Guided progression vs. total freedom | The step-by-step journey reduces paralysis | It removes free exploration — but the data showed that freedom without a reference produced abandonment, not exploration |
The solution
The structure
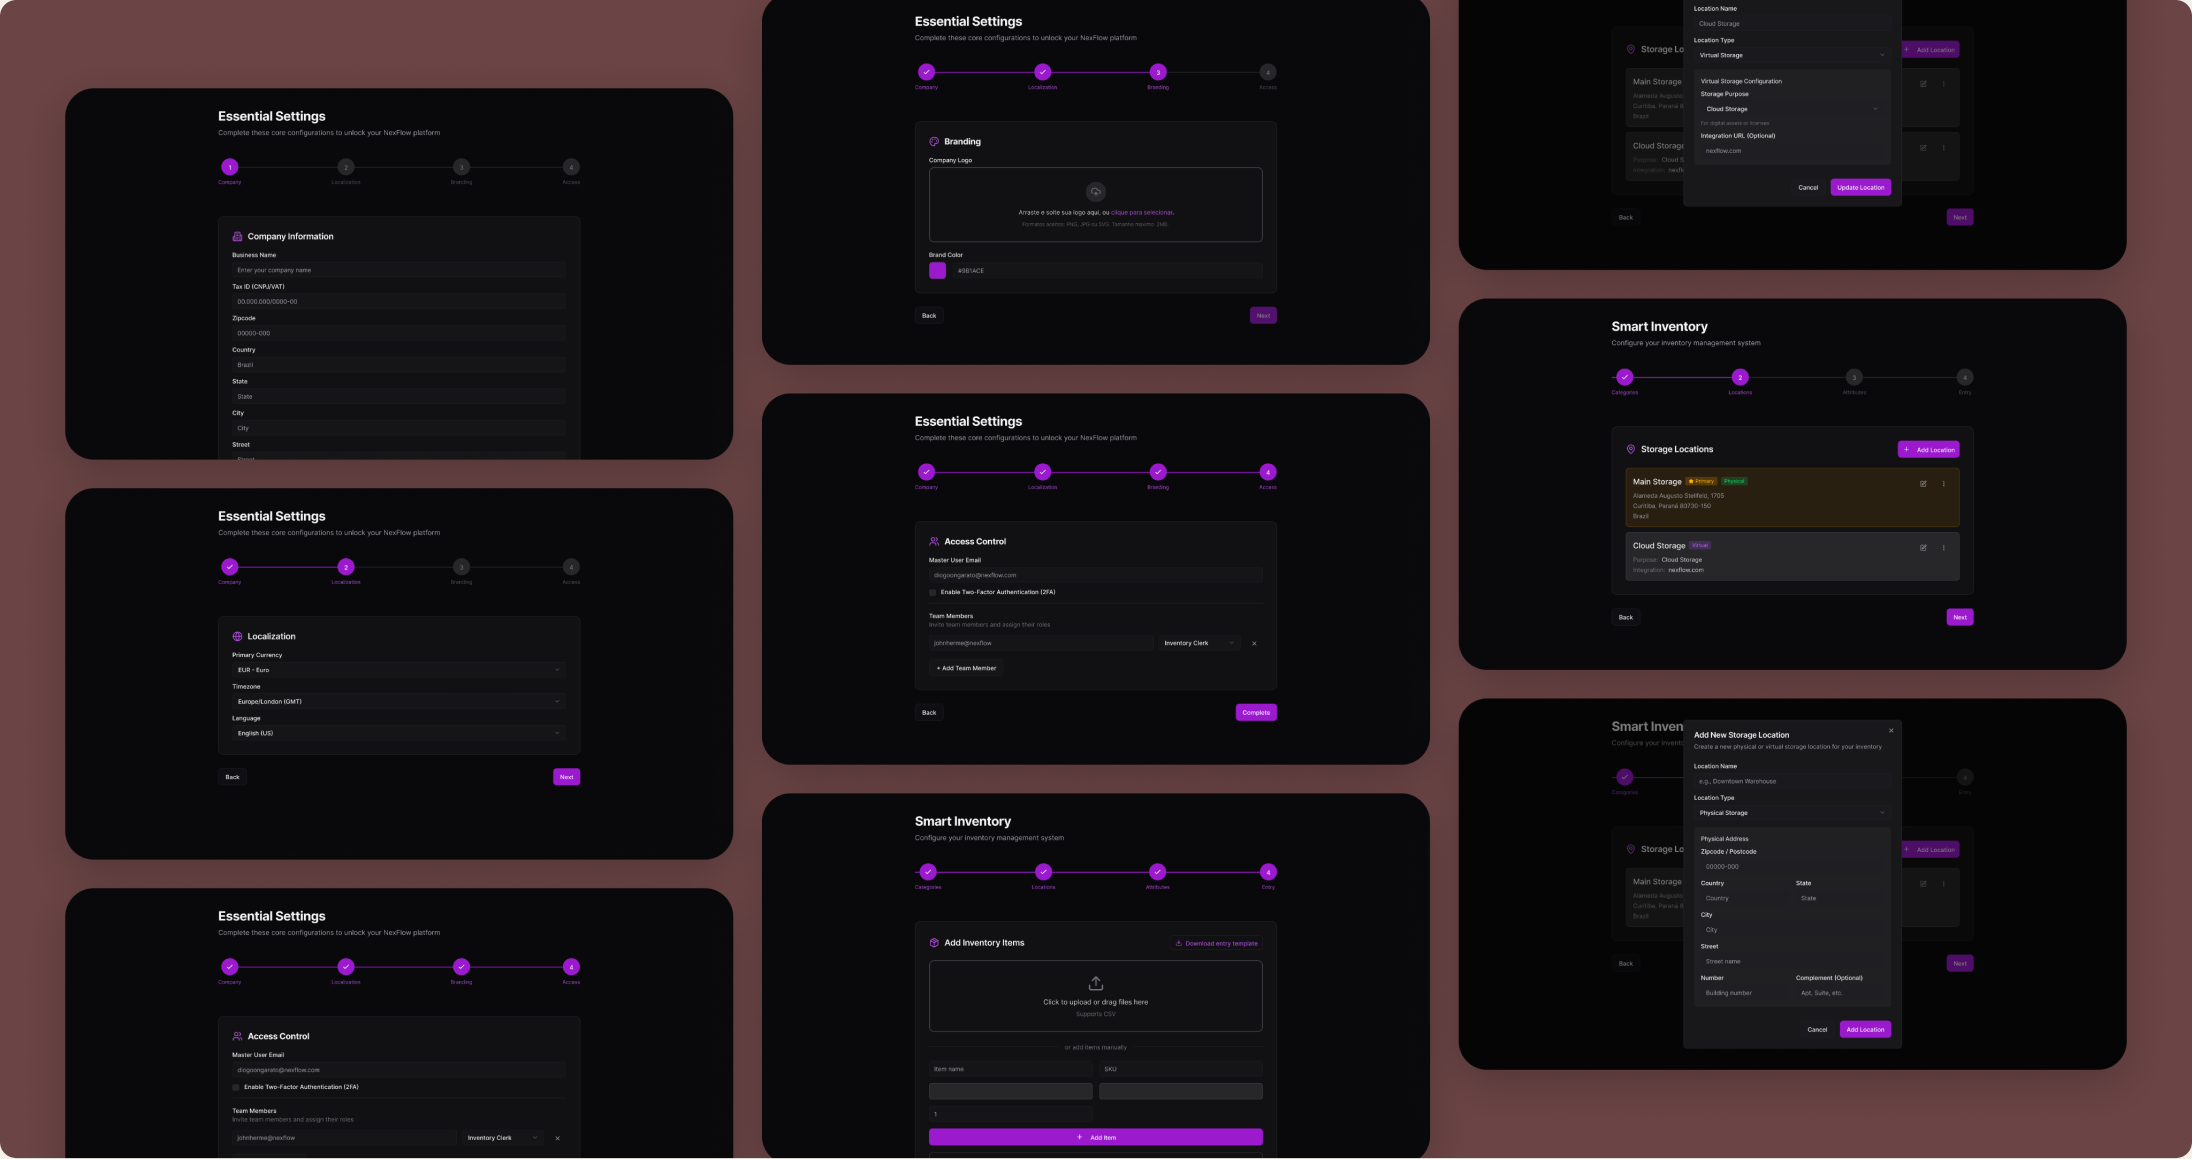
A 4-step wizard as a direct application of progressive disclosure: the user never sees the whole complexity at once. On first access, only the essentials are active — the optional steps appear as the foundation gets established.
The steps
- 01Foundation
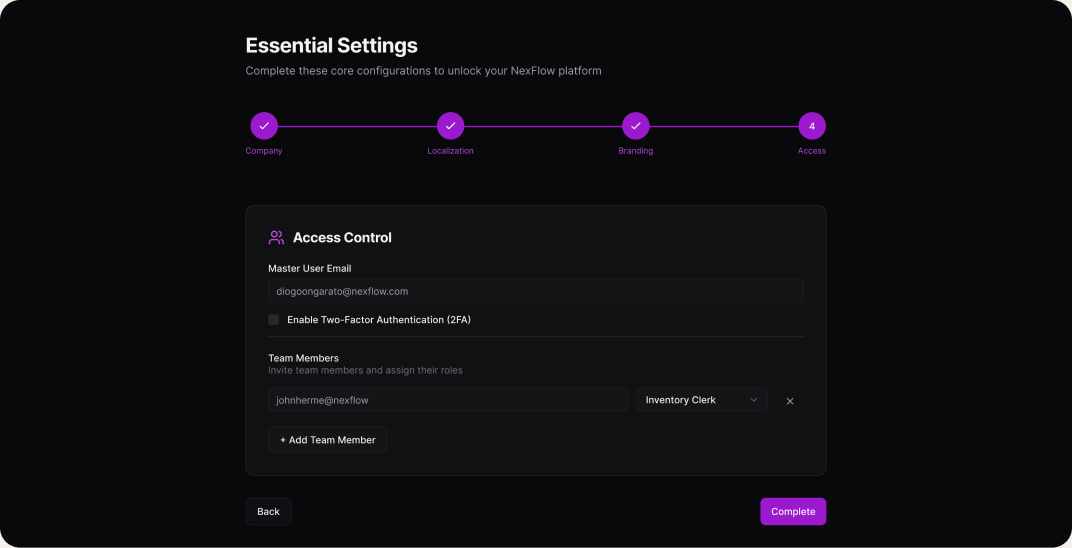
Company details, MFA and access management.
MFA and access management are technical prerequisites, but also the user's first contact with the platform. The design treated this step as a front door, not paperwork — every field has context and progress is visible from the start.
- 02First module
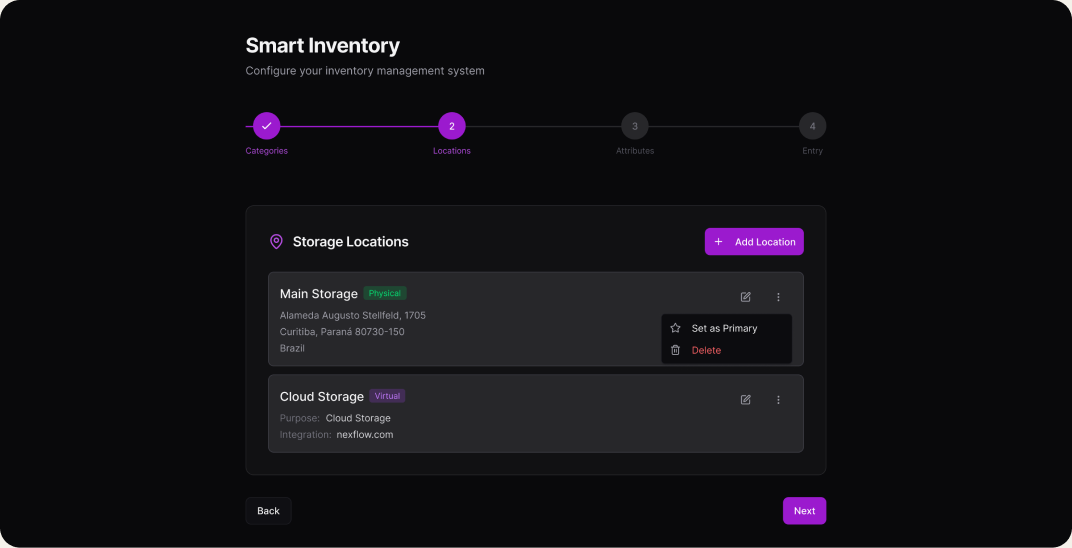
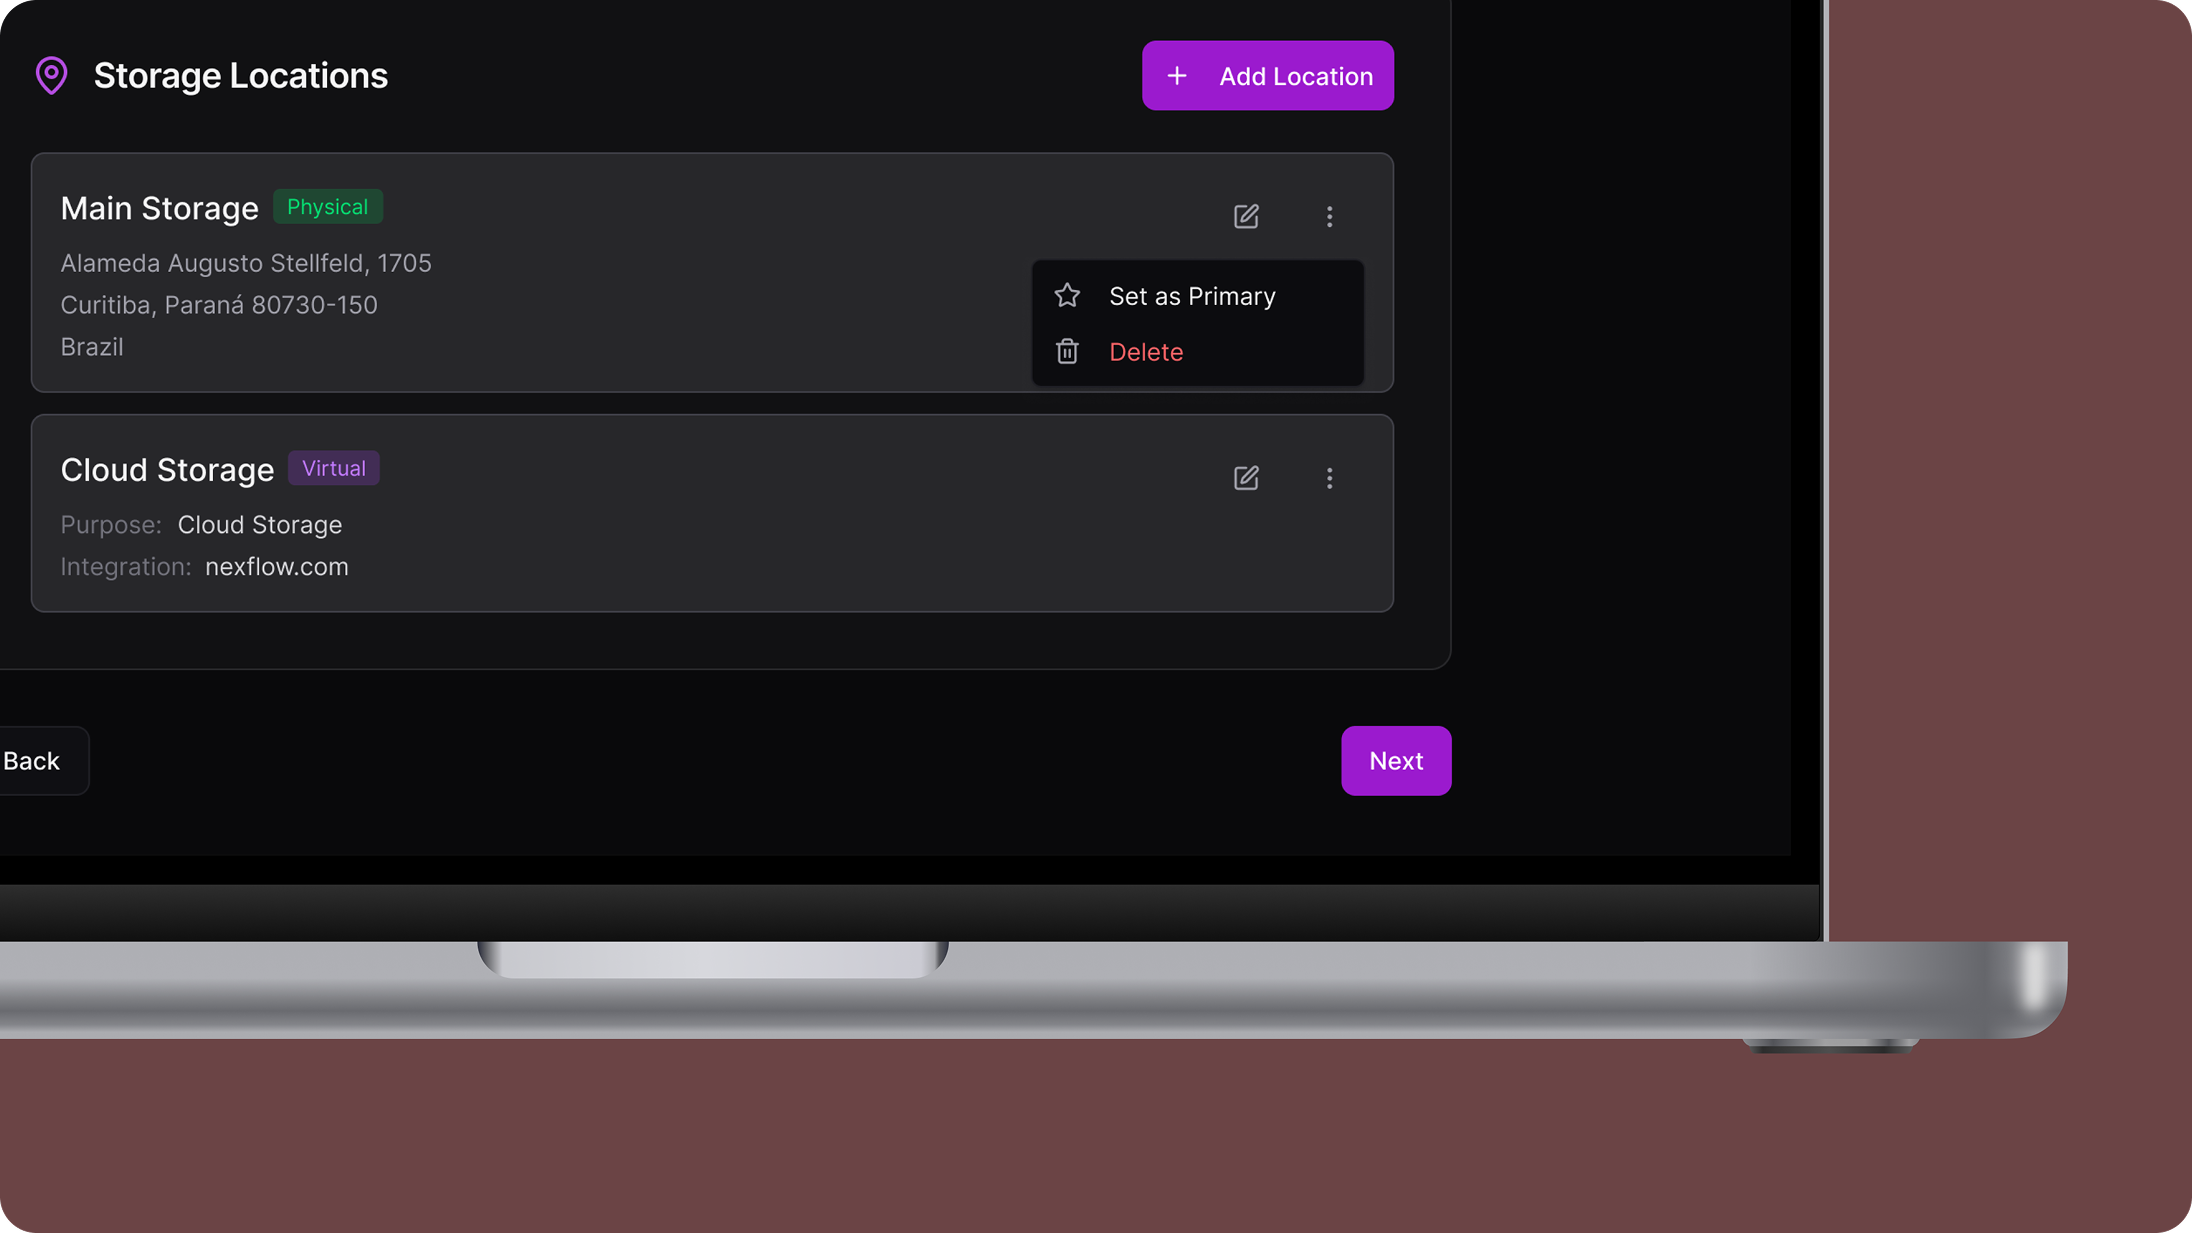
Activating the priority core module.
The 'everything at once = paralysis' finding drove this decision: instead of unlocking the whole system, the user activates one module at a time. In testing, Smart Inventory was prioritized spontaneously — the module the team saw as complex was the one users most wanted to configure first.
- 03Free expansion
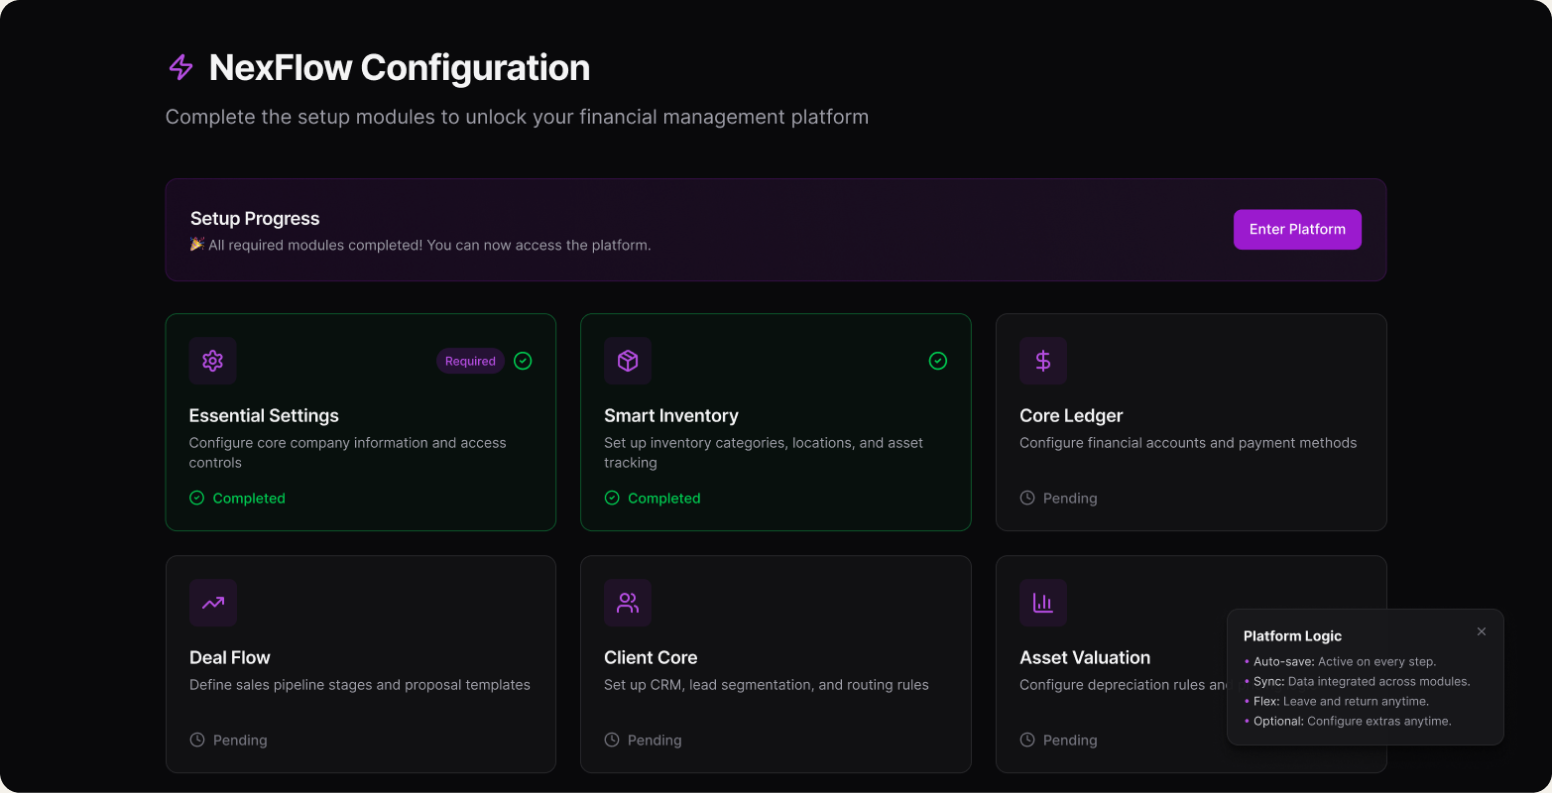
Additional modules at the client's own pace.
Optional, without blocking use of the platform. The moment the user imported their first assets and saw them on screen was the turning point — tangible proof that the system already knew their business.
- 04Entering the environment
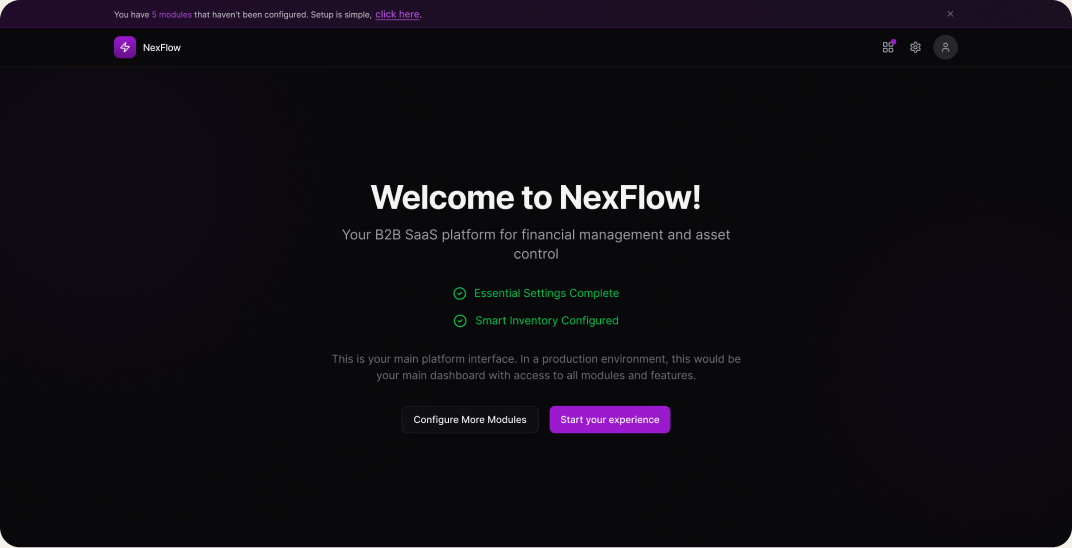
Access to the configured platform.
The hub stays as a persistent reference — what's been activated, what can still be explored and where CS is available. The platform doesn't 'start' here; it started at the first step.
Error prevention
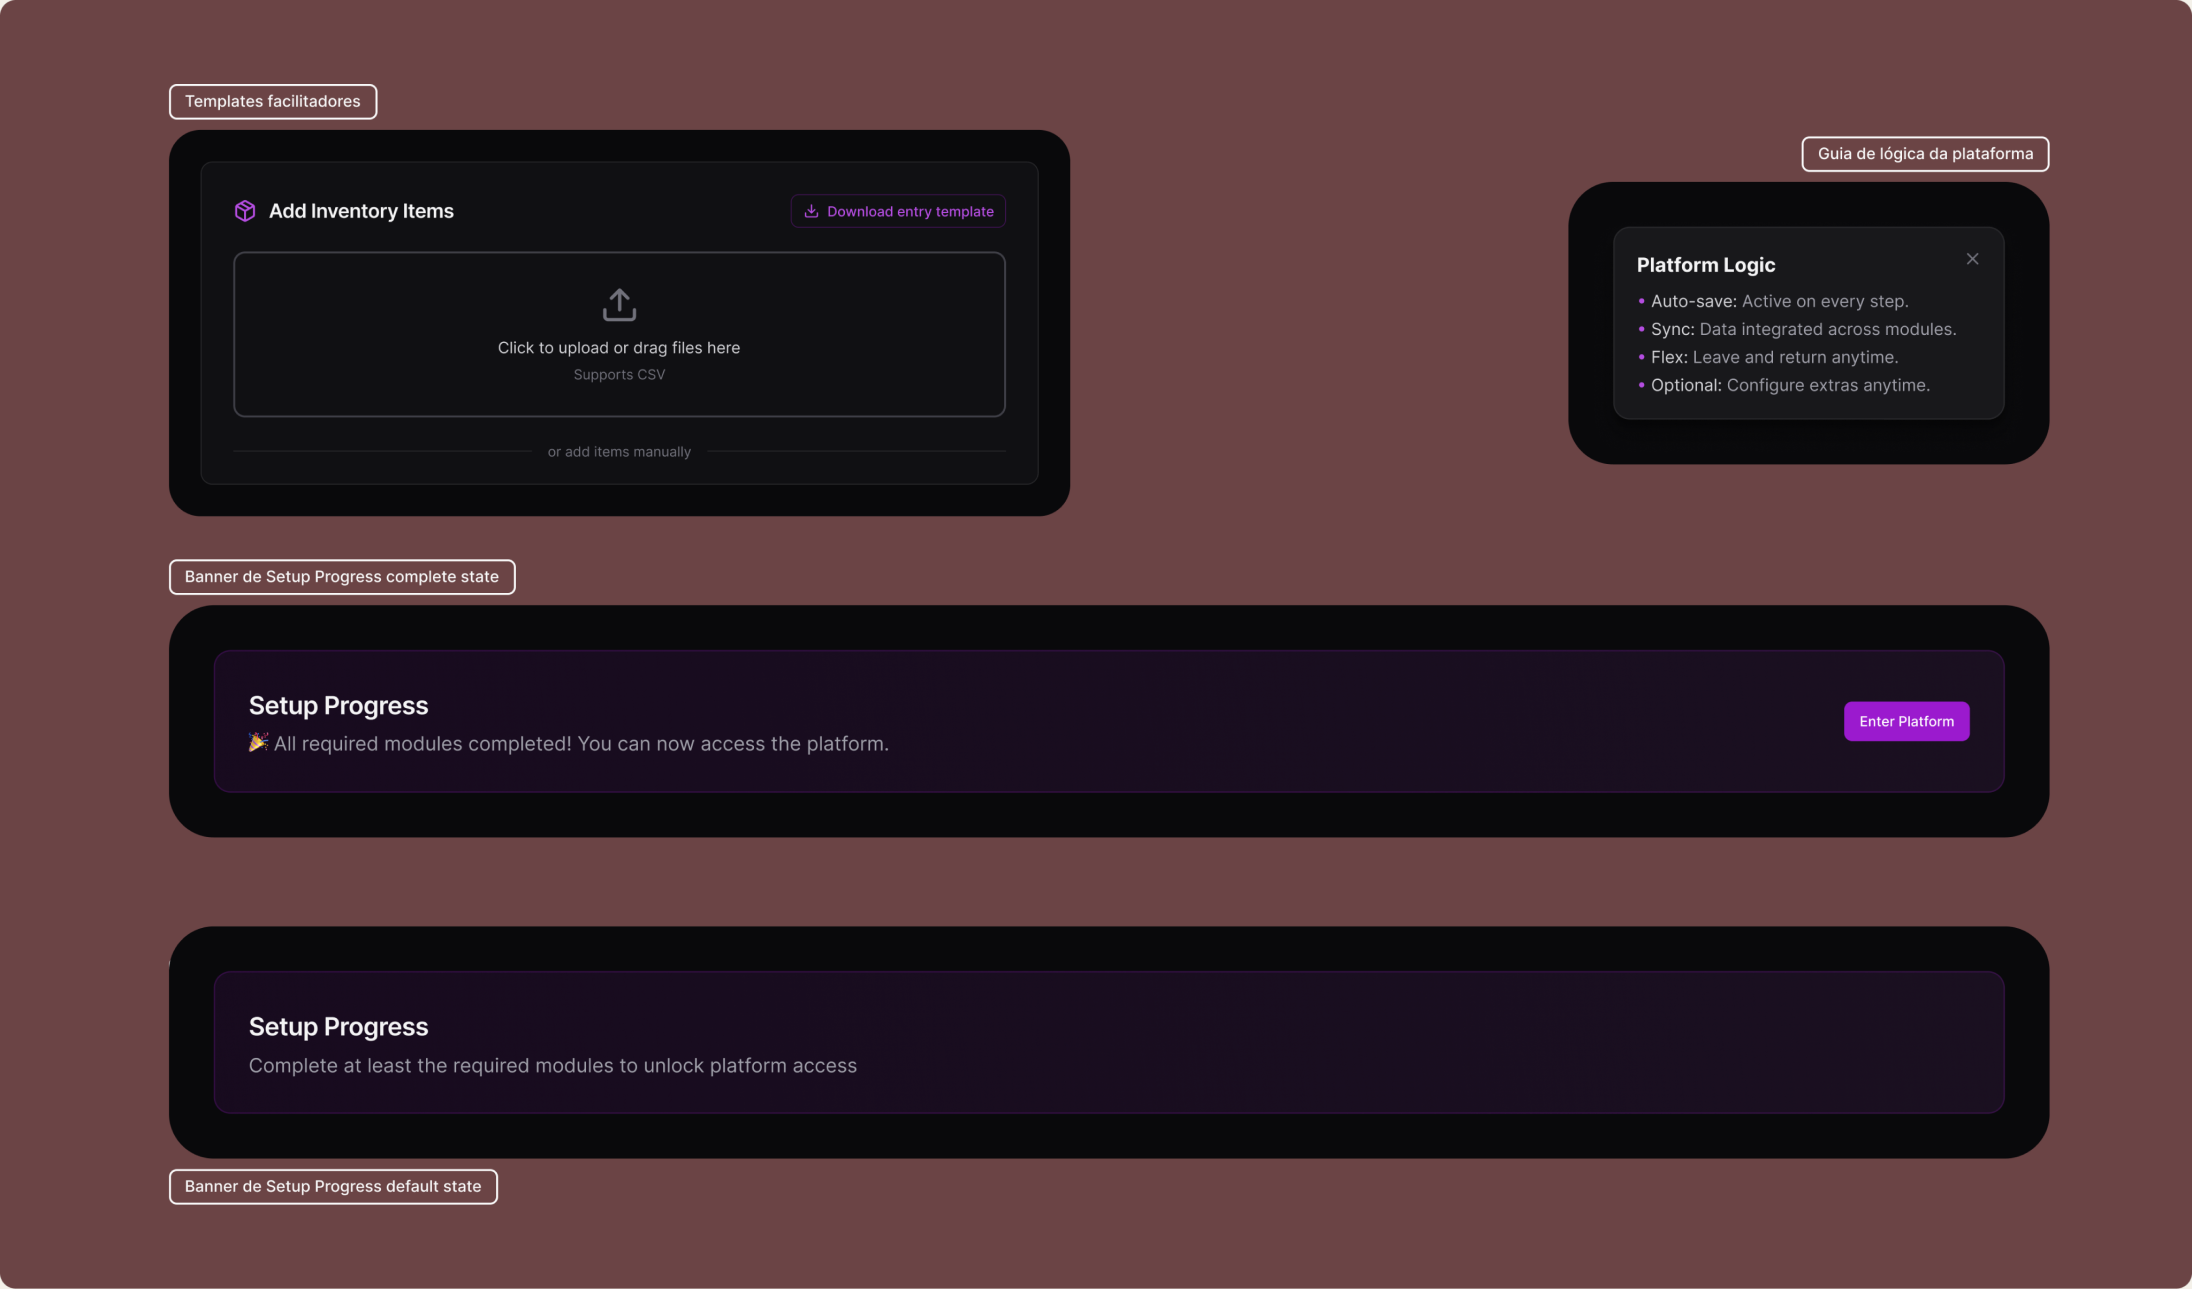
A pillar of the flow was anticipating friction before it turned into an error, across three layers: contextual alerts in the hub pointing to the next required action, pre-validated templates in the Smart Inventory import removing trial and error, and technical constraints communicated before the input — not after the failure.
Stakeholders Review
The situation
With discovery complete and the solution defined, I presented the proposal to the stakeholders. Two fears surfaced immediately: the risk of more support tickets from giving users more autonomy, and the build time — the full solution involved many flows and shipping it whole would take a while.
Shifting to a Lean UX process
Rather than backing off in the face of resistance, I proposed a Lean UX approach: narrow the scope into a functional MVP — the most critical flows first — for fast sign-off. Real production data would be the criterion for expanding, not the initial bet.
Data as the argument
We released the first flows, analyzed the real numbers, and signed off on the rest inside the hub as the behavior held up in production data. The stakeholders went from resistant to advocates of the approach.
Validation and iteration
The method
I reviewed the prototype with CS — who knew the old flow best — and tested with newly signed clients, the profile closest to real onboarding.
The iterations
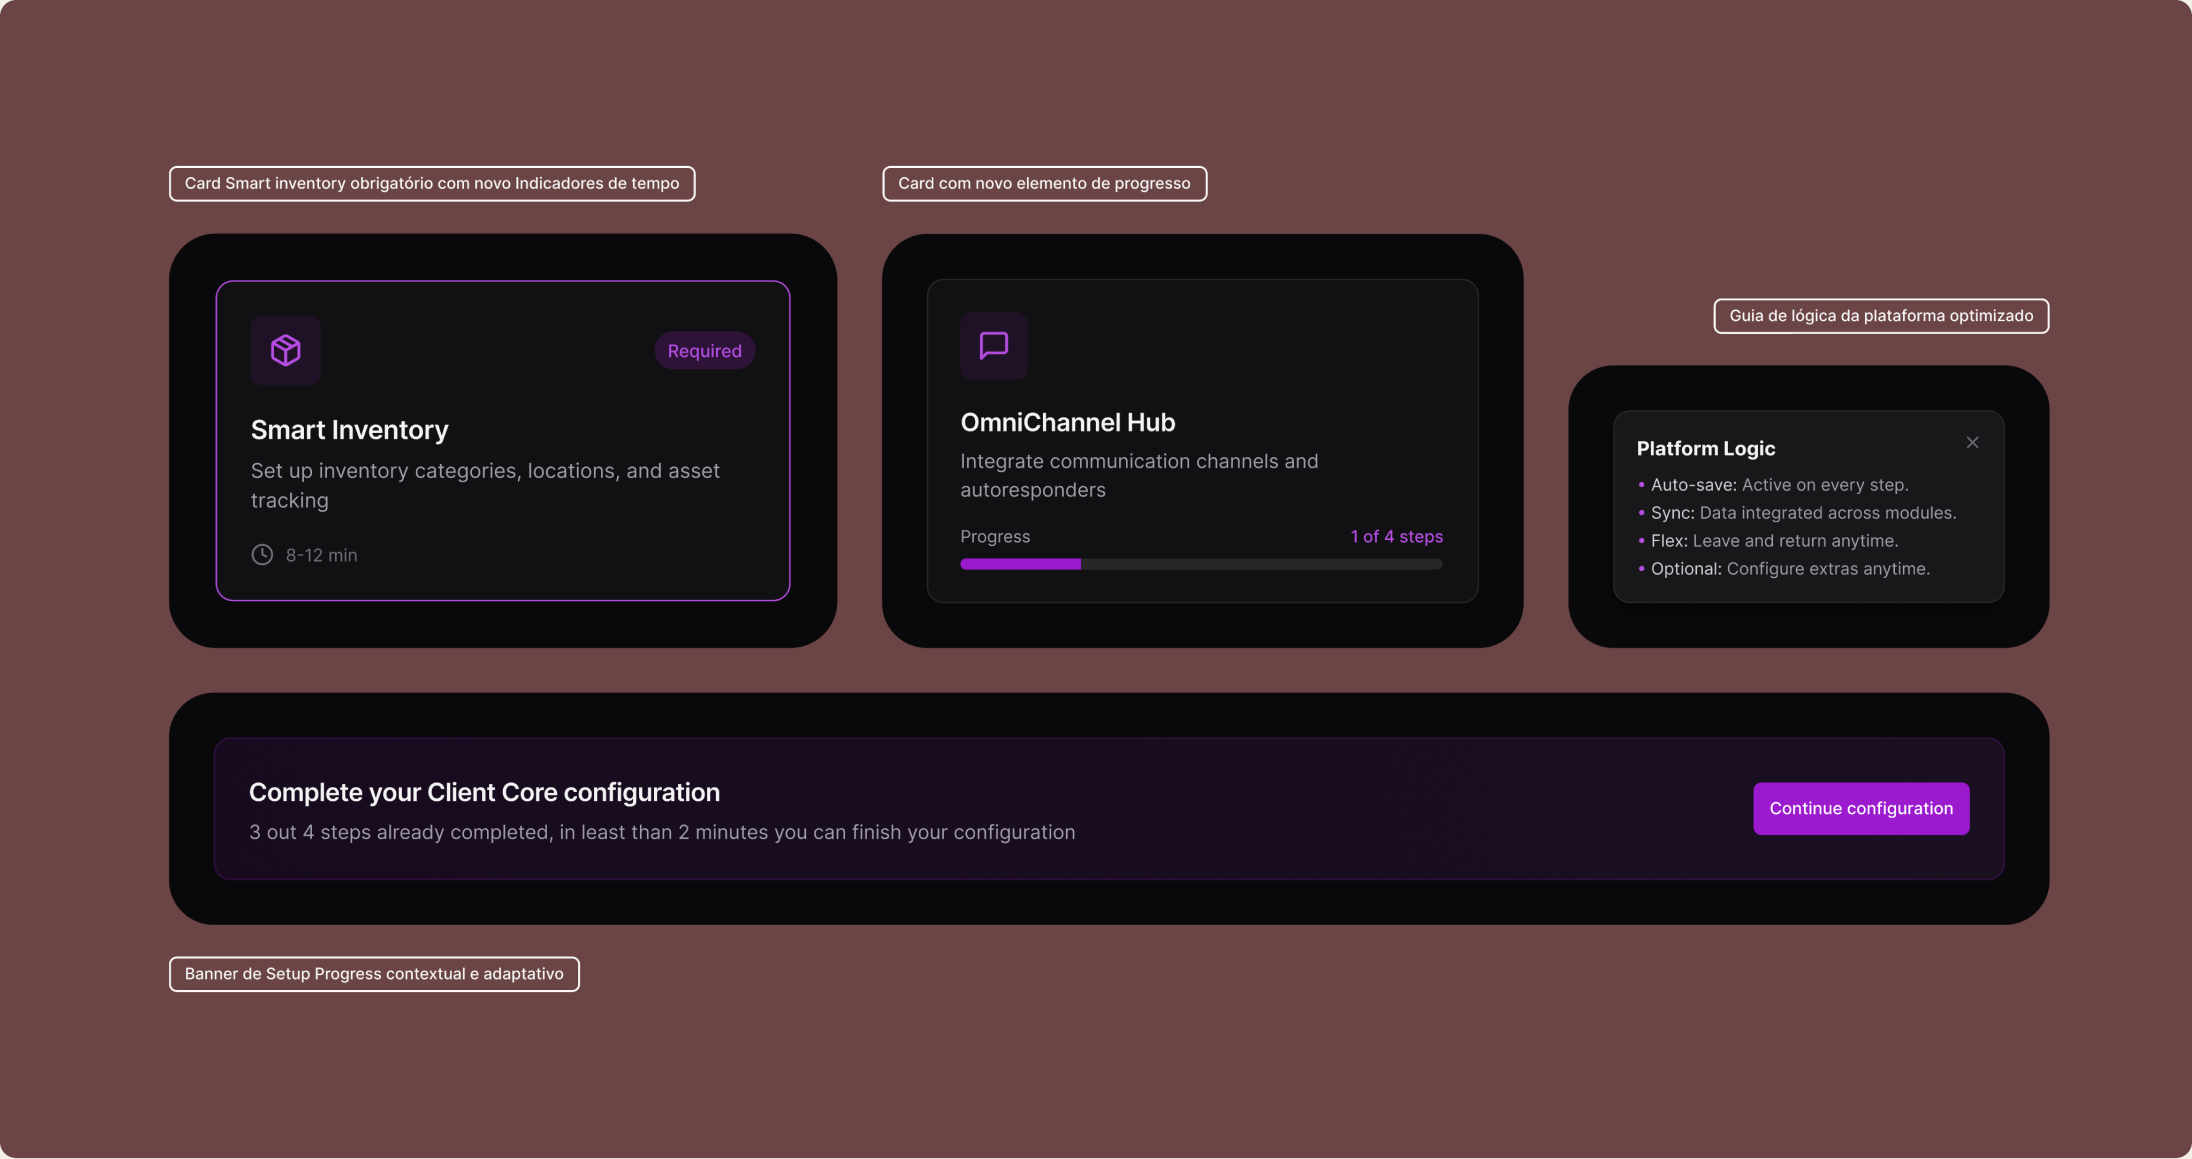
Smart Inventory became the entry point
In testing, users prioritized Smart Inventory spontaneously when given a free choice. Since the module concentrated the most business value, the evidence consolidated the decision to position it as the primary required step — a decision born from observed behavior, not from the initial hypothesis.
Time and progress on the cards
The lack of a reference for the expected effort created hesitation before each step. I added estimated time and progress indicators to reduce uncertainty — the same 'wait with no yardstick' logic from discovery, now inside the flow.
Persistent logic guide
Users showed recurring doubts about how the settings related to one another. I added an always-accessible, never-intrusive logic guide, working as a reference anchor without interrupting the flow.
Adaptive progress banner
Even with the hub, certainty about the next action was missing. I created 5 states for a banner that updates dynamically with progress, signaling the next step and nudging pending configurations.
Impact
What the numbers revealed
The engagement paradox
In the first 60 days, tickets about advanced flows — no longer about basic onboarding — went up. Users activated quickly explore more, and with more confidence. The very data point stakeholders feared (more tickets) became the proof that autonomy worked.
Data as discovery
Usage of optional modules became a signal of intent — correlating features to high-value segments and feeding the product's next iterations.
Gradual expansion validated
The flow was released as an MVP and expanded iteratively as the data confirmed the expected behavior. The modules signed off bit by bit inside the hub went from a point of stakeholder resistance to an internal reference for how to validate and grow a feature.
Early churn down 12%
With TTV falling from 12 days to 1, clients started extracting real value far sooner. The 12% drop in early churn — measured in the first 90 days after signing — was the most relevant impact for the business: retention at the most critical phase of the client lifecycle.
Learnings
Complexity is a design job, not a problem
The risk was never in the depth of the task, but in the absence of a structure to navigate it. A well-structured flow made advanced ERP configuration accessible to users with no technical background.
Data opens, qualitative steers
The internal data that opened the project was the trigger, but discovery showed what it didn't say: the problem wasn't that onboarding was manual, it was the lack of reference and progression for the user.
Tickets as a proxy for UX
The drop in operational tickets and the rise of advanced-usage tickets, together, tell a richer story than either metric on its own.
What's next
The rise in tickets about advanced flows wasn't just a metric, it was a product signal: it revealed exactly where friction shows up after activation.
The next step is using that data to pay closer attention to specific high-friction points — bulk asset import, permission setup by branch and app integrations — using real behavior to prioritize, not assumption.